Using the RentalTrax rantal mangement reporting system can provide you with sales and revenue projections for your business. You will have multiple reports including revenues based on Order, Customers, Products and Categories; as well as the ability to see who has bought certain products within your system.
To view Sales Reports go to Reports > Sales.
Revenue Report – Orders
This screen will show you your revenues based on the orders created within your system. You will also be able to see your growth over the previous year to see how your business is trending. To view this report go to Reports > Sales > Revenue (select Order Tab).
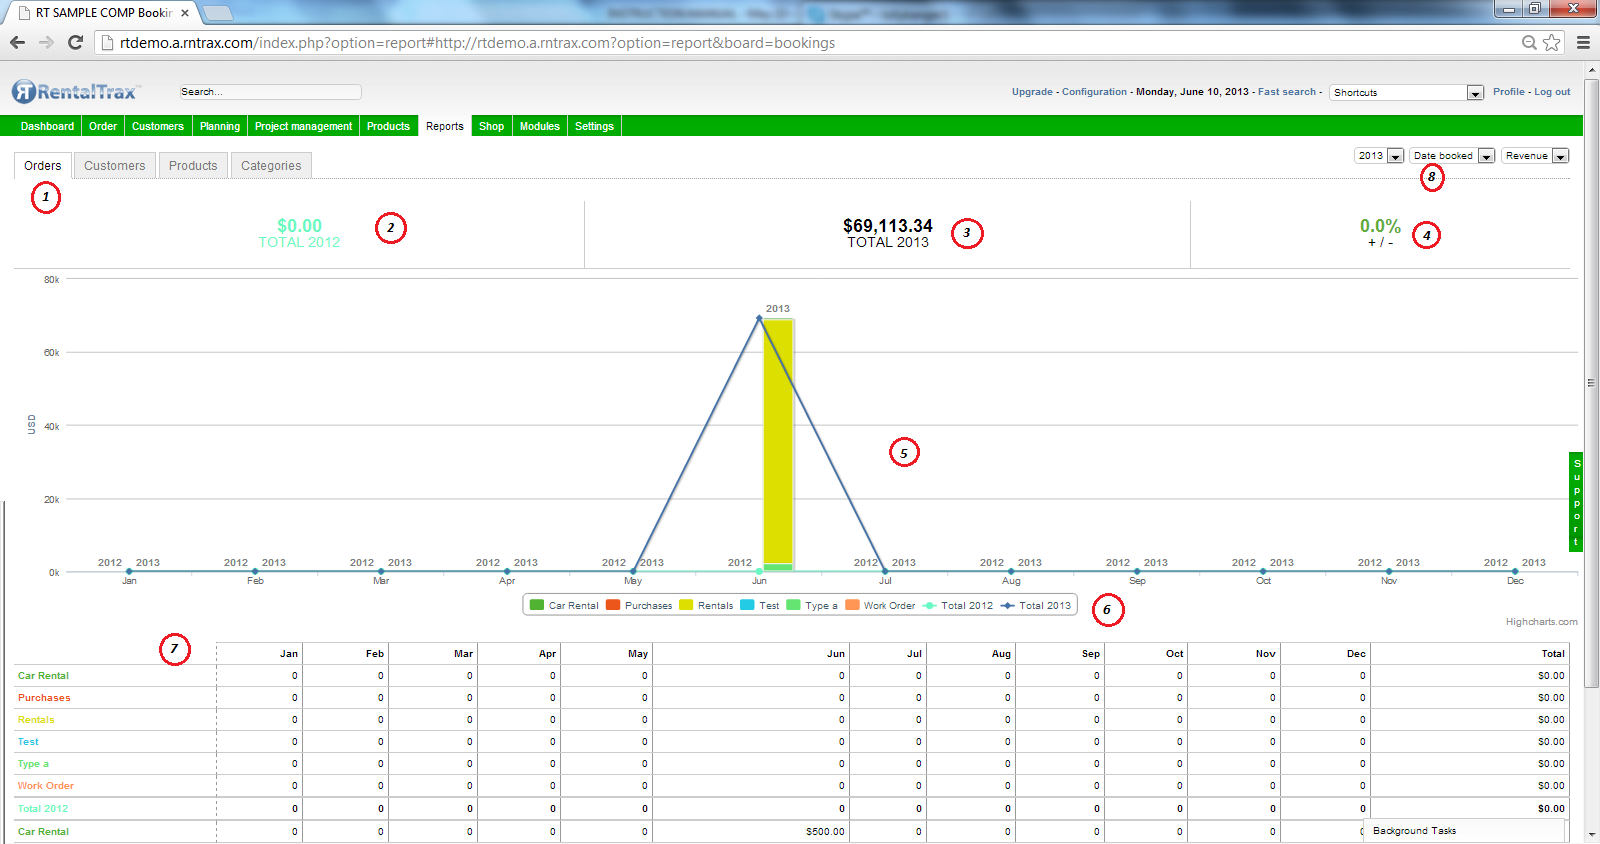
1) Order Tab
2) Previous Year Sales Volume – The previous year’s revenue will be displayed in this area.
3) Current Years Sales – The current revenue will be displayed based on the orders within your system.
4) Percentage Change – This area will display the percentage of change between the previous year’s revenue and the current year’s revenue.
5) Graph Display – The graph will display the revenue totals based on orders and month
6) Order Legend – The legend will provide color coded information to make understanding the graph easier.
7) Order Calendar Chart – This area will display the month revenues in dollar value sorted by order type
8) Selection Drop Down – The drop down menu’s will allow you to create more detailed information based on your order revenue. Select from the following:
Year Displayed – Choose the revenue report going back to all years you have shown revenue within the RentalTrax System.
Graph Display – Choose to display the information based on the date the order was Created or the date that the order was Booked.
Quantity or Revenue – Select whether the graph will show the quantity of items purchased or the revenue received.
Revenue Report – Customers
The customer revenue report provides you with information on income based on the customers you have dealt with. You can view past sales values as well as current revenues. To view the customer revenue report, go to: Reports > Sales > Revenue Report (Click Customer Tab).
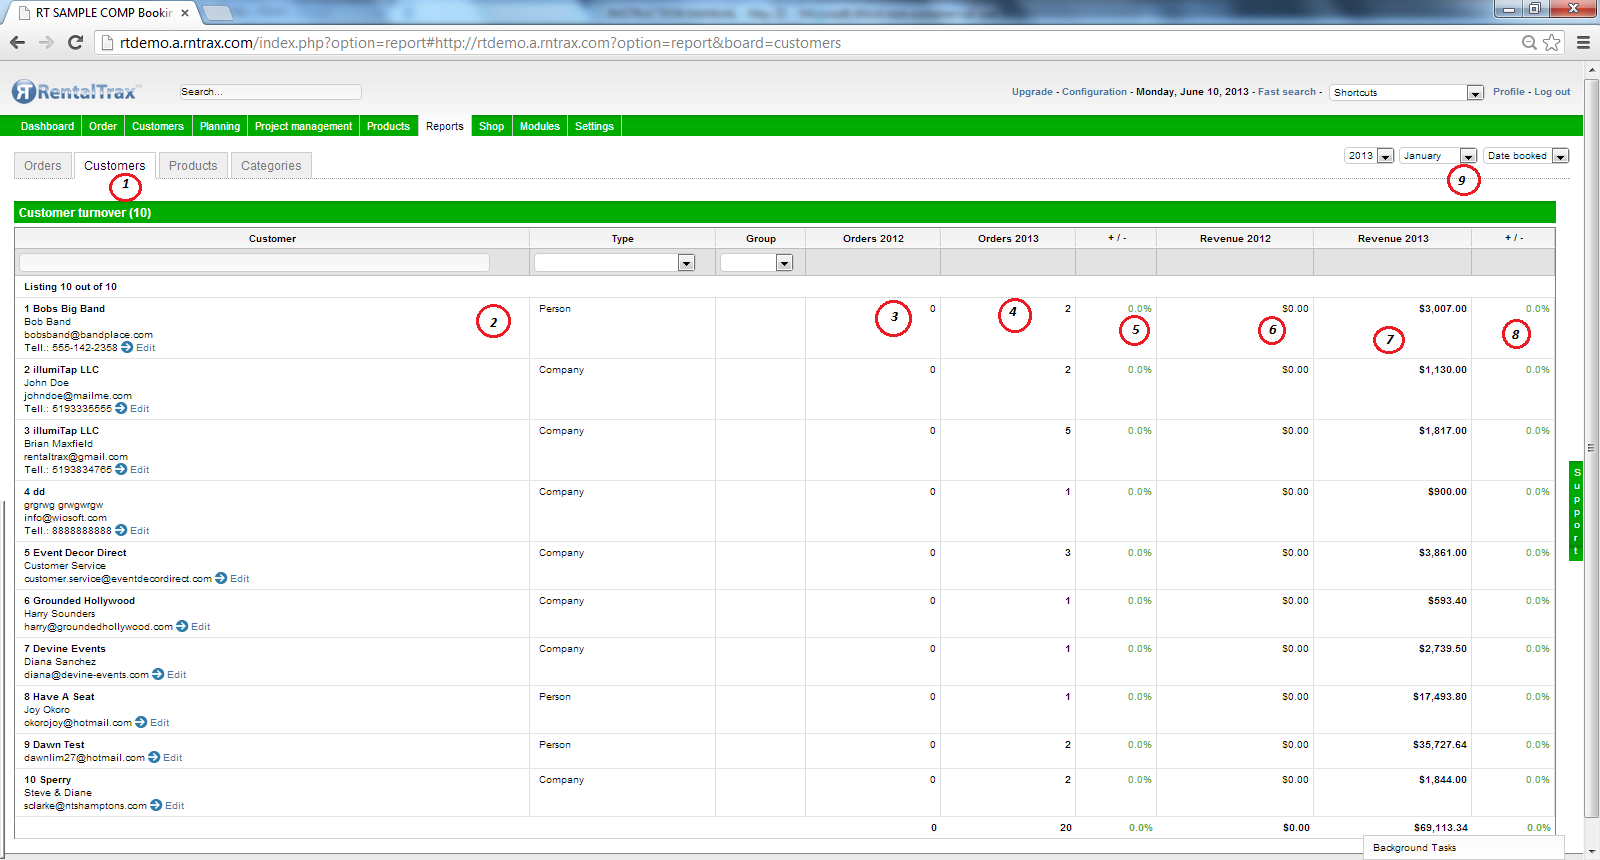
The Customers report will provide you with a brief display of your customers activity inside the system. You can see percentage changes from year to year as well as total revenue dollars.
1) Customers Tab
2) Customer Column – Here you will find the customers information as well as the edit link in case you need to make any changes to the customers file
3) Previous Year Column (Orders) – The number of orders placed by this customer in the previous calendar year
4) Current Year Column (Orders) – The number of orders placed by this customer in the current calendar year.
5) Percentage Change (Orders) – The percentage of growth or decline from previous calendar year to the current calendar year based on orders placed.
6) Previous Year Column (Revenue) – The total dollar value in revenue generated from this client in the previous calendar year
7) Current Year Column (Revenue) – The total dollar value in revenue generated from this client in the current calendar year
8) Percentage Change (Revenue) – The percentage of growth or decline from previous calendar year to the current calendar year based on revenue generated.
9) Drop Down Menus – Use the drop down menu’s to display a variety of different information based on year, month and sortable by status and date.
Revenue Reports – Products
The products report is very similar to the customer report; however, this report focuses on the changes and revenues generated by product.
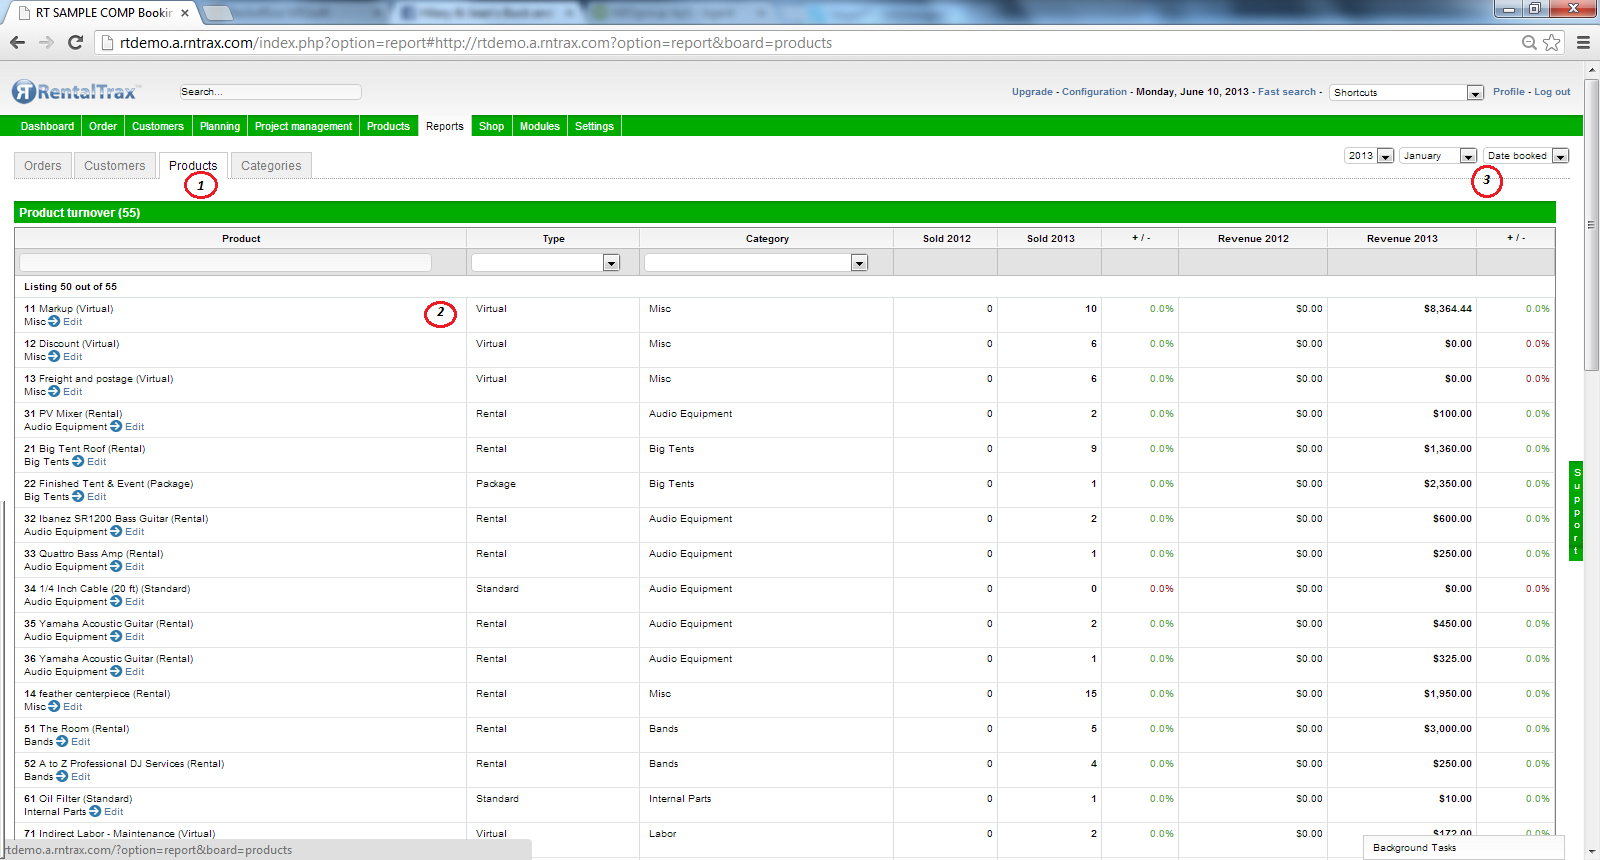
1) Products Tab
2) Product Column – The product column will display the product information as well as a link to edit the product itself. The rows will display information such as the type of product, category and the percentage changes and totals from the previous year to the current year based on revenue and total orders.
3) Drop Down Menus – The drop down menu’s will provide you with advanced sorting functions such as displaying by Month, Year, and more.
Revenue Reports – Categories
The Categories revenue report provides you with a break down of your business growth based on the categories of products you have created within your system. To create a new category, go to Products > Category and follow the instructions explained earlier within the RentalTrax Setup and Instruction Manual.
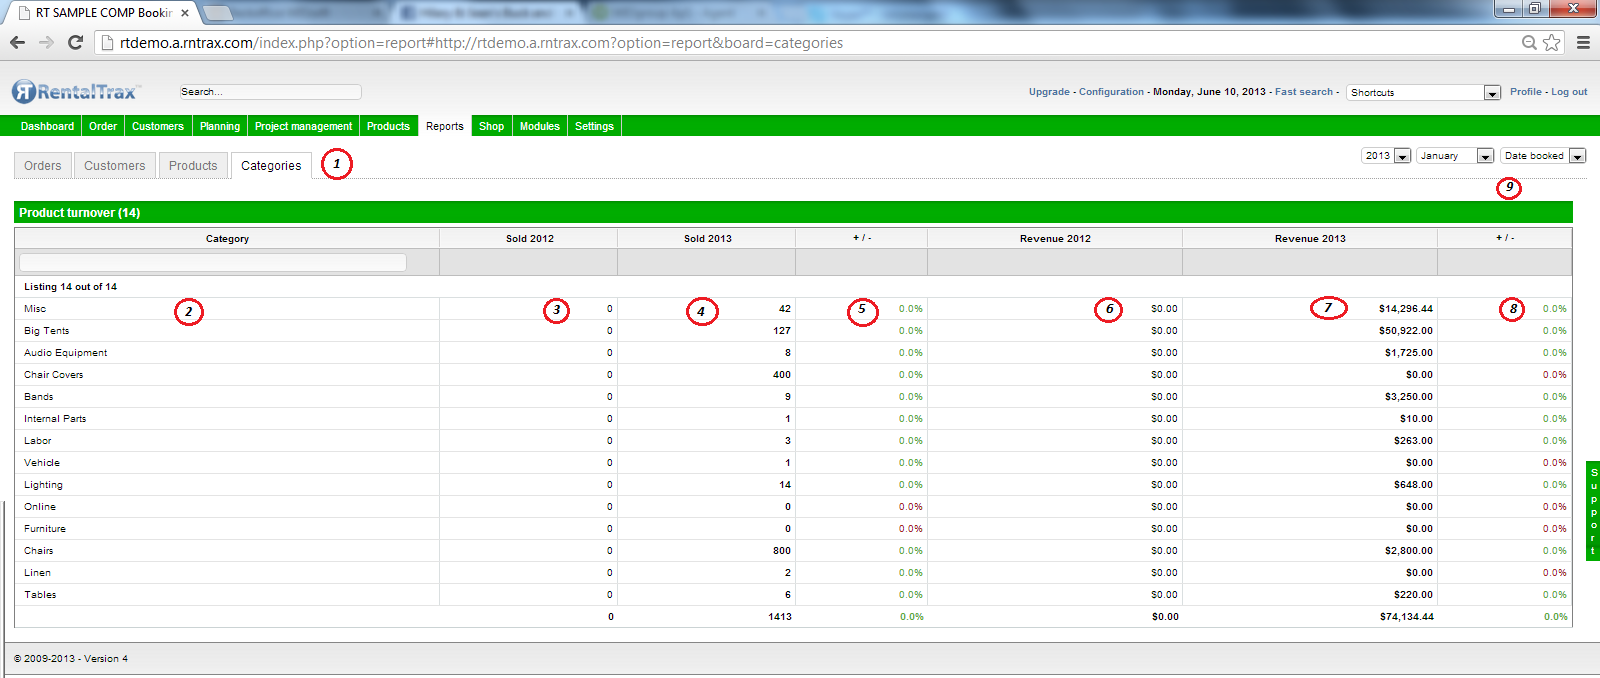
1) Categories Tab
2) Category Column – The product categories that you have created for your system will be listed here. You may sort this column and use the text field to search as well.
3) Previous Year Sold Column – The total number of products sold / rented in the previous year will be displayed in this column.
4) Current Year Sold Column – The total number of products sold / rented in the current year will be displayed in this column.
5) Percentage Change (Sold) Column – The percentage of growth or decline based on the previous year and current year products sales will be shown in this column.
6) Previous Year (Revenue) Column – The total revenue generated by this product category will be displayed in this column.
7) Current Year (Revenue) Column – the total revenue generated by this product category will be displayed in this column.
8) Percentage Change (Revenue) Column – The percentage of growth or decline based on the previous year and current year products revenue will be shown in this column.
9) Drop Down Menu - The drop down menu’s will provide you with advanced sorting functions such as displaying by Month, Year, and more.
Revenue Report – Who Has Bought
Tracking who has purchased / rented your equipment, as well as multiple groupings of equipment is done using the RentalTrax Who Has Bought Report. To access this report, go to: Reports > Sales > Who has bought.
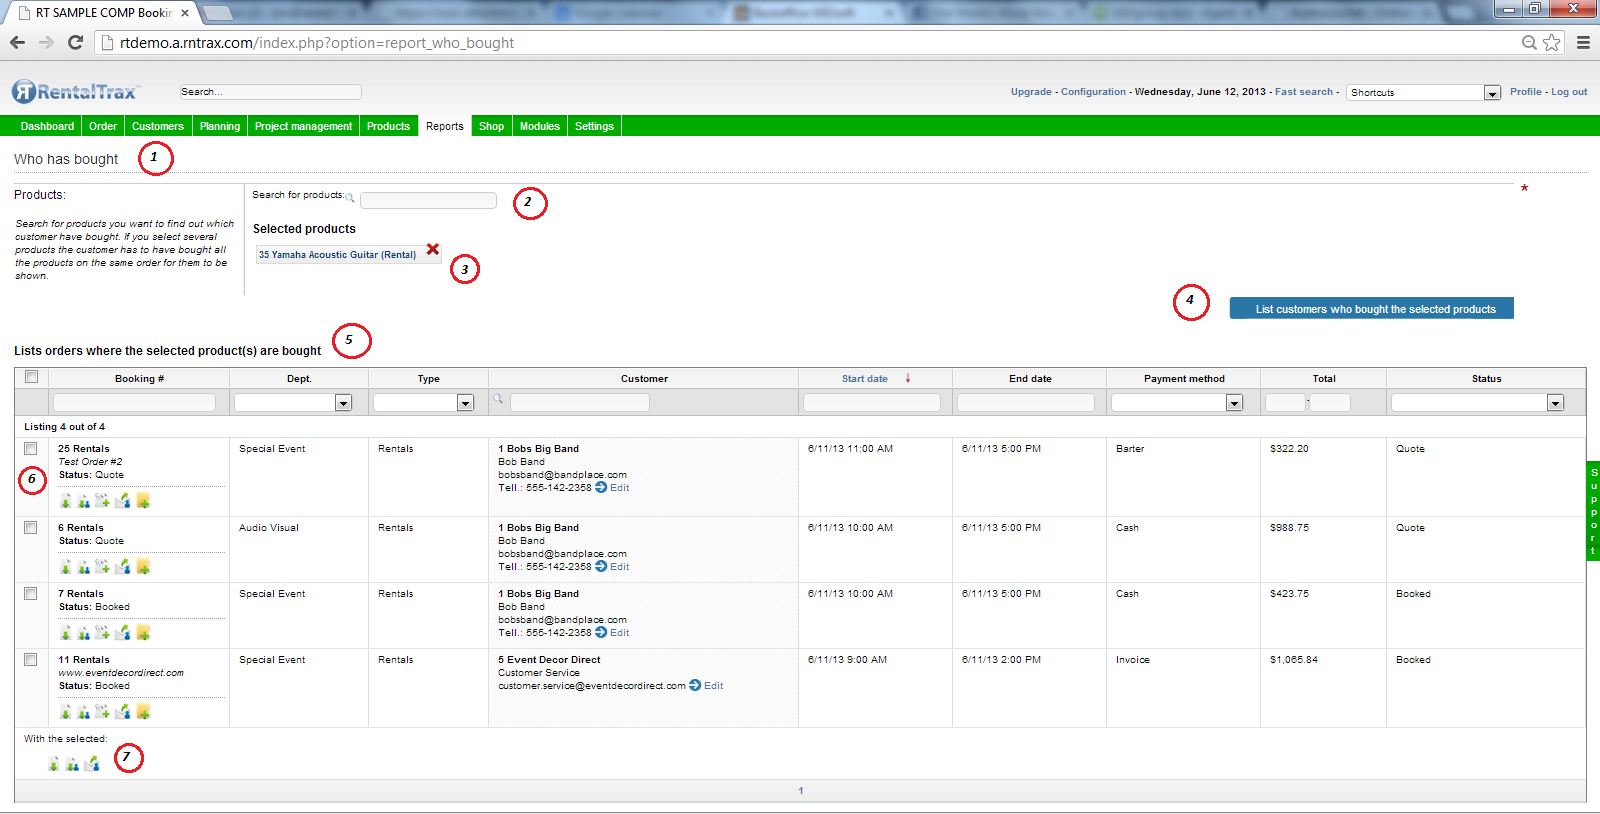
1) Who Has Bought Title
2) Product Search Field – Enter in the product you wish to display the report on. This field is an intuitive field and will populate any products with the sequence of letters entered. Once you have selected a product, you may enter multiple products to create a group report.
3) Selected Products Display – You will see the products that you have selected for the report listed here. You may enter multiple products using the above search field. The red x located on the product will remove the product from the report.
4) List Customers Button – Use this button to activate the report based on the products you have selected.
5) Report List – All of the clients who have purchased / rented the products you selected will be listed below.
6) Order Rows – A row will be generated for each time a client has rented / purchased the products selected from you. This row will contain a check box (for advanced features), order information (including action icons, department, type, customer information (including edit customer link), start and end date of the rental, payment method, order total and status of the order. These columns allow for a search function and sort function.
7) Advanced Functions – Using the checkboxes beside the order rows will allow you to send group e-mails to the clients listed above, as well as download bulk internal order sheets and customer order sheets. HINT: This can be helpful when communicating to a specific target audience who regularly purchases a specific product. Create an e-mail template designed specifically towards this group.
0 Comments