Step Thirty-Seven: Stock Dashboard
Utilize the Stock Dashboard to make sure that you can meet your client’s needs. If you have disabled stock control (Settings > Basic Settings) then you can over book your items. You will then use the Stock Dashboard to be able to see which items are overbooked in a time period, by how much, and under which orders. To access your Stock Dashboard, go to: Dashboard > Stock Tab.
View the How-To Video HERE: Stock Dashboard
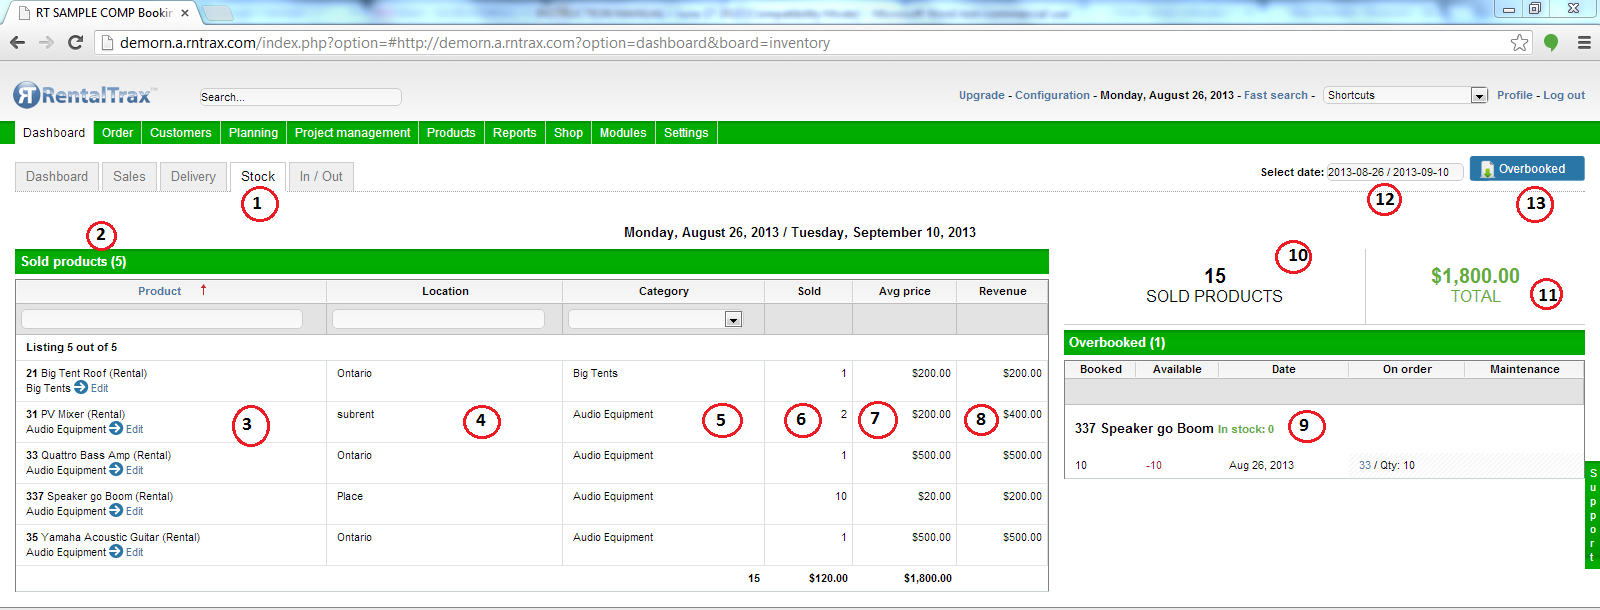
1) Stock Dashboard Tab
2) Sold Products Display – This area of the dashboard will provide you with what products have been sold based on the selected date (step 12)
3) Product Column – This product will show you which specific products have been sold in this date range. Each product will include an edit link. This column can be sorted and searched using the heading bar
4) Location Column – This column will show the location of the given product. This column can be sorted and searched using the heading bar
5) Category Column – This column will show the category that the product falls under. This column can be sorted and searched using the heading bar
6) Sold Column – This column will show you how many units of this product have been sold during the given time period
7) Average Price Column – This column will show you the average price for the product during the given time period
8) Revenue Column – This column will show you the revenue generated by the product during the given time period
9) Overbooked Products – This column will show you which products are overbooked. The first column shows how many products are booked in total. The Available column shows how many products are available in that time (a negative number means you are overbooked by that amount). That date column shows which date you are overbooked on. You can see which order is affected in the On Order column. You can click on the order number to see the order sheet for that order. You are also shown how many products are on that order.
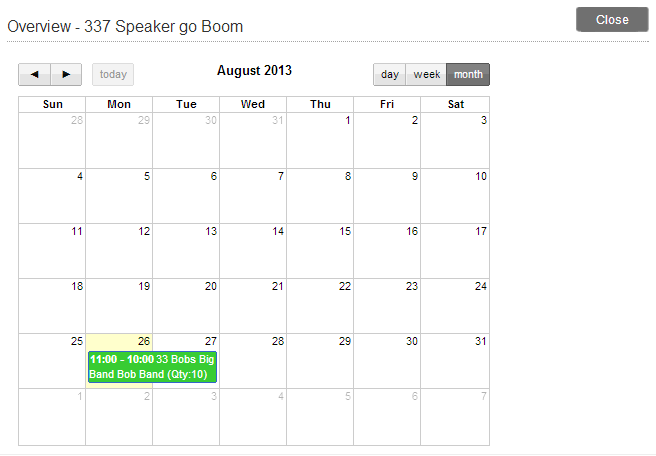
Note: If you click on the product in the booked column, you will be provided with a calendar view of your bookings.
10) Sold Products Quadrant – This area will show you how many products have been sold total during this time period
11) Total Revenue Quadrant – This area will show you the total revenue generated during the given time period
12) Select Time Period – Click on the date field to activate the calendar feature to select your time period. You can look up specific dates, or use the many options to look up time periods
13) Overbooked Button – Click on this button to download the overbooked stock report for the given time period
0 Comments